

Overview
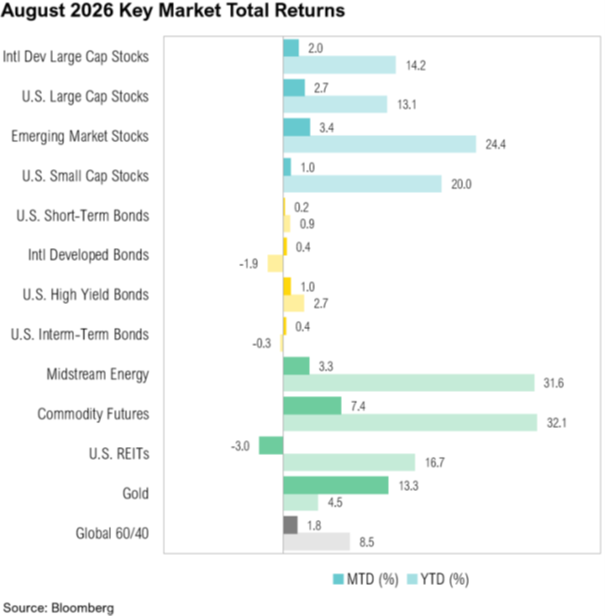
U.S. large-cap stocks, as measured by the S&P 500 Index, gained 2.7% in August, while the small-cap Russell 2000 Index gained 1.0%. Through the first eight months of 2026, the S&P 500 is up 13.1%, and the Russell 2000 is up 20.0%. U.S. intermediate-term bonds, proxied by the Bloomberg U.S. Aggregate Bond Index, increased 0.4% in August, bringing their year-to-date return to -0.3%.
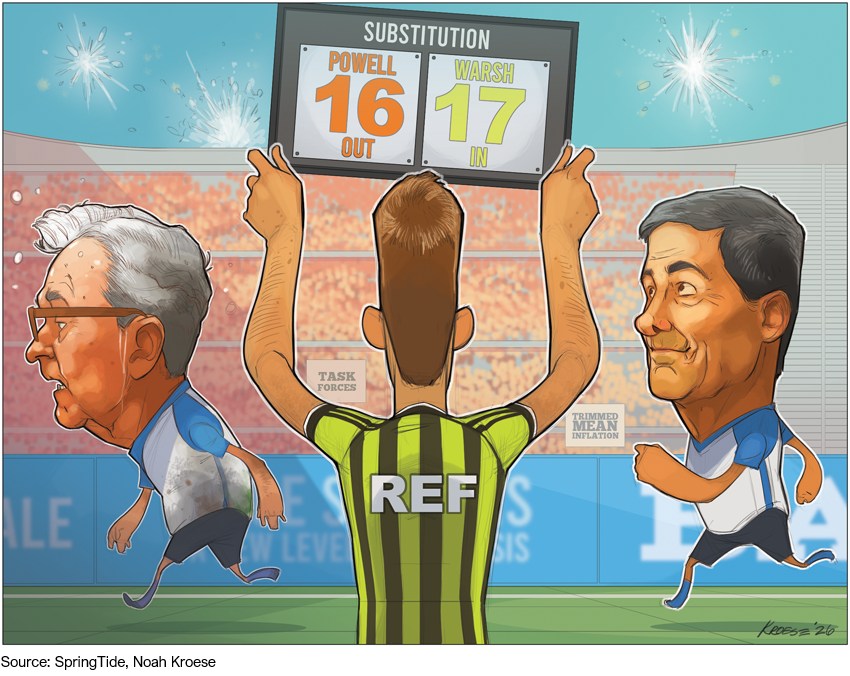
The most recent inflation data came in largely as expected. Core PCE, which excludes food and energy, remained steady at 3.3% year over year, and headline PCE posted a 3.7% year-over-year move. Personal income and spending both beat estimates in July, and second-quarter GDP grew at a 1.5% annualized rate.1 The labor market sent mixed signals as nonfarm payrolls unexpectedly fell by 23,000 in July against expectations for an 80,000 gain. In the past year labor market gains have averaged just 26,000 a month, including five months with a decline.2 The unemployment rate ticked down to 4.1%, and weekly initial jobless claims remained subdued.
Higher interest rates continue to weigh most clearly on housing. Starts dropped 12.4% in July, and single-family starts fell to their weakest pace since late 2022.3 Consumer confidence also softened. The Conference Board’s Consumer Confidence Index fell to a seven-month low of 89.4 in August.4 Manufacturing and services PMIs were consistent with growth. The ISM Manufacturing PMI hit 55.6 in July, its best reading since May 2022, and ISM Services remained steady at 54.1.5
Earnings
By the end of August, almost all S&P 500 companies had reported second-quarter earnings. As the reporting season progressed, the index’s earnings growth rate increased from 23% at the end of June to 52% by the end of August, marking the strongest quarterly earnings growth since the second quarter of 2021.6 Revenue growth also accelerated to 15.5%, the highest since the fourth quarter of 2021.6 S&P 500 net profit margins reached a record 17.0%, the highest reading since FactSet began tracking the metric in 2009. Looking ahead, analysts expect full-year 2026 S&P 500 earnings to grow 31%, followed by a further 14% increase in 2027.6
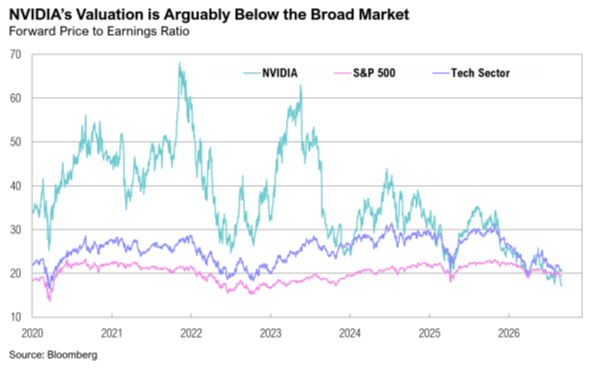
NVIDIA reported record quarterly revenue of $96 billion, up 106% year over year, and data center revenue was up 117%.7 The results beat consensus on both the top and bottom lines, and management raised the outlook for the next fiscal year to roughly 70% revenue growth. Management indicated that unconstrained demand would run meaningfully higher than the roughly 70% growth figure implied and that the 70% instead reflects what NVIDIA can confidently supply, with supply remaining the bottleneck.7 Asked directly what growth would look like unconstrained, CEO Jensen Huang responded: “The unconstrained would be a lot higher. We grew 100% year-over-year this year. The unconstrained is significant. And so we’re just going to have to work hard to get more capacity.”7
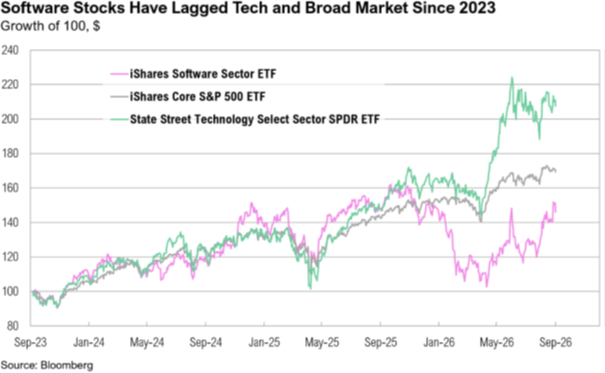
Software stocks continued their sharp climb from the “SaaSpocalypse” selloff earlier this year, which took the group down more than 35% before it bottomed in April. Since then, software has rebounded more than 45%, returning to positive territory year to date, although much of that gain has simply recovered ground lost earlier in the year. The rebound itself has been lopsided. Cybersecurity rose 84% from its lows, compared with 46% for the iShares Expanded Tech-Software ETF, 30% for the Technology Select Sector SPDR Fund, and 13% for the S&P 500. More recently, the rally broadened beyond cybersecurity. Some software companies benefitted from AI adoption rather than facing the disruption initially feared.8 On August 27, Salesforce rose 23% after stronger-than-expected second-quarter results and improved guidance, underpinned by accelerating AI-related demand, and Agentforce annual recurring revenue exceeded $1.5 billion, up more than 240% year-over-year.8
Jackson Hole
Jackson Hole has become one of the Fed’s most important venues for signaling changes in policy. Fed chairs have repeatedly used the symposium to frame major shifts before they are reflected in formal Federal Open Market Committee decisions.9 Former Fed Chair Ben Bernanke used the platform in 2010 to lay the groundwork for a second round of quantitative easing and returned in 2012 to signal a third round of easing later that year. In 2022, Fed Chair Jerome Powell used Jackson Hole to deliver a blunt warning that restoring price stability would bring “pain” to households and businesses, prompting a sharp drop across major equity indices as markets recalibrated to a more aggressive rate-hike path.10
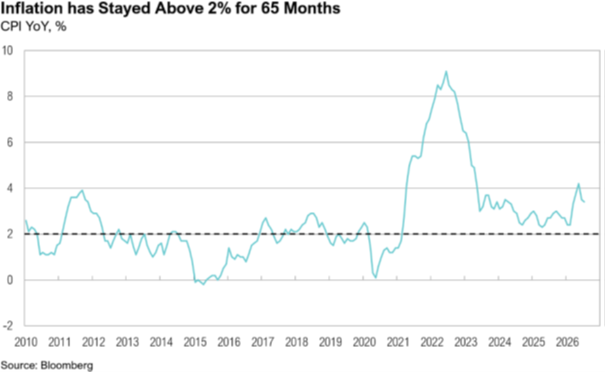
Two years before that, Powell used Jackson Hole to introduce a flexible average inflation targeting framework, intended to allow inflation to run modestly above 2% following a sustained period of undershoot and to give policymakers more room to support the labor market.11 Inflation ultimately ran far beyond that intended modest overshoot, with CPI peaking at 9.1% in June 2022. The 2020 framework shift remains part of this year’s backdrop, as inflation has now remained above the Fed’s 2% target for 65 consecutive months. 12
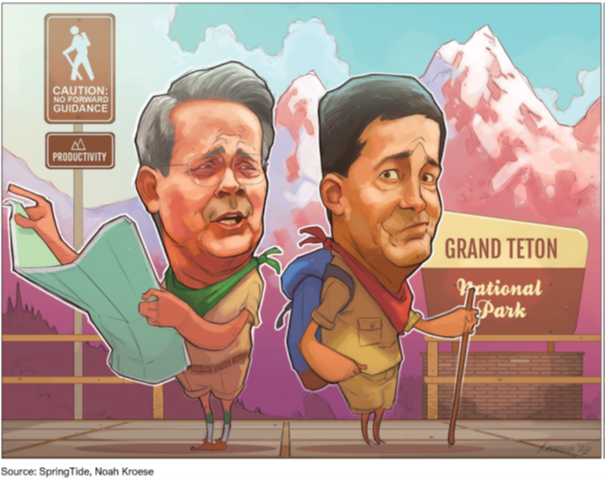
This year’s theme, “Financial Innovation: Implications for Payments and Policy,” gave Kevin Warsh his first high-profile opportunity as Fed Chair to lay out his framework. He focused on AI, forward guidance, the principles guiding monetary policy, and his assessment of the economy today. Warsh also highlighted five Fed task forces reviewing areas including communications, balance-sheet policy, inflation frameworks, and the implications of emerging technologies for productivity and employment. Warsh noted that their recommendations will come later and will not affect current policy decisions.12
Consistent with his public comments since his January nomination, Warsh reiterated his opposition to forward guidance, arguing that explicit signaling can create a feedback loop between the Fed and markets that leaves policymakers less prepared when conditions change: “The economic literature has long described the distorting effects: a hall-of-mirrors problem. If markets rely materially on the Fed’s guidance and the Fed relies on market prices, we are all more likely to be blinded to new developments … more likely to be caught unprepared for a turn of events … and more likely to commit errors in policymaking.”12
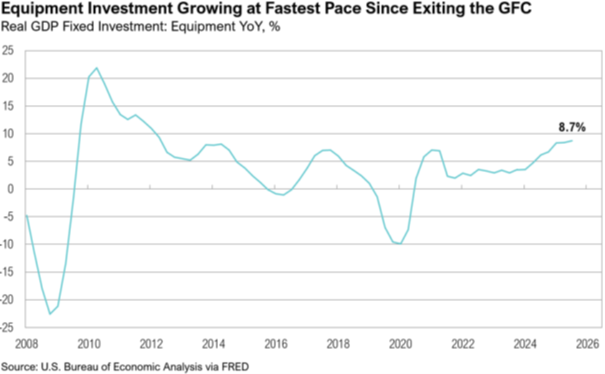
Warsh characterized current economic conditions as healthy, citing low unemployment, solid private-sector demand, and accelerating business investment, including AI-related capital spending. On inflation, however, he acknowledged that progress remains incomplete. Roughly 54% of goods and services in the Fed’s preferred PCE measure have risen more than 3% over the past year, down from a post-pandemic peak of roughly 77% but still well above the 32% average that prevailed during the two decades before the pandemic.12
Warsh also reiterated his skepticism toward quantitative easing as a routine policy tool, arguing that short-term interest rates should remain the Fed’s primary instrument and unconventional policies should generally be reserved for genuine crises. That preference is already visible in Fed operations. Reserve-management purchases, the routine Treasury bill buying used to maintain ample bank reserves, fell to zero in mid-August. The program began at up to $40 billion per month in December 2025 before declining to $25 billion in April, $10 billion by mid-2026, and ultimately zero as reserve levels normalized.13,14
Markets responded quickly. September rate-hike probabilities, which had fallen sharply through July on softer inflation and labor data, moved back to 62% following the speech, while Treasury yields rose across the curve and continued higher into September.15
Markets
The S&P 500 Index gained 2.7% in August, outperforming the MSCI EAFE Index, which rose 2.0%. U.S. intermediate-term bonds gained 0.4% but remained negative year to date.
Long-dated Treasuries remained under pressure. The 30-year yield reached its highest level since 2007 on August 17, a move that partly reflected higher real yields and that Warsh has attributed to underlying economic strength and reduced reliance on forward guidance.16 Treasury Secretary Scott Bessent has also pointed to increased hyperscaler debt issuance as a source of pressure on longer-term yields.17 The Treasury subsequently announced that it would at least double the size of its 10- to 30-year buyback operations, from $2 billion to at least $4 billion per operation beginning September 9. Treasury characterized the change as an expansion of an existing liquidity-management program rather than a new initiative.18
From the buyback announcement through month end, gold gained 2% and Bitcoin rose 22%. The 10-year Treasury yield increased 5 basis points to 4.75%, while the 30-year yield declined 4 basis points to 5.24%.
Looking Forward
Longer-term interest rates are particularly important to economic activity and market valuations, influencing borrowing costs across the economy and the discount rates applied to financial assets. While short-term rates remain closely tied to monetary policy, longer-term rates must also absorb Treasury supply, fiscal pressures, and nominal GDP growth that has accelerated to levels last seen in the early 2000s, outside of the COVID-19 recovery.
We believe the Fed and Treasury are increasingly coordinating their respective policy tools in response to these pressures. Warsh has argued for less reliance on the Fed’s balance sheet and a return to short-term interest rates as the primary tool of monetary policy, while Treasury has expanded its long-end buyback program. The buybacks remain tiny relative to quantitative easing, so we view them less as a market-moving force and more as a signal that Treasury is willing to use its debt-management tools more actively.
Warsh’s broader argument that unconventional policies such as quantitative easing should be reserved for genuine crises represents a meaningful break from some of the policy constructs that followed Jackson Hole 2020 and, in our view, contributed to the subsequent inflationary episode. AI adds another wrinkle. Warsh noted that AI could become a new factor of production with implications for both the economy and monetary policy. The buildout is already supporting capital spending and credit demand, but the productivity payoff may matter more. If AI allows the economy to grow faster without generating comparable inflation, the Fed could ultimately have more room to accommodate stronger growth. If that payoff is slower to emerge while investment and nominal growth remain strong, pressure on longer-term rates could persist.
The combination of a changing Fed framework, less forward guidance, pressure at the long end of the curve, and uncertainty around AI-driven productivity leaves a wide range of possible outcomes for the remainder of 2026 and into 2027. We remain focused on assets with attractive risk/reward potential across those outcomes, while generally favoring an allocation geared toward higher nominal growth and recognizing that sustained productivity gains from AI could prove supportive across markets. At the end of the day, investors can debate what the Fed and Treasury should do, but markets will be driven by what they actually do.
Disclosures
The material shown is for informational purposes only. Any opinions expressed are current only as of the time made and are subject to change without notice. This report may include estimates, projections or other forward-looking statements; however, forward-looking statements are subject to numerous assumptions, risks, and uncertainties, and actual results may differ materially from those anticipated in forward-looking statements. As a practical matter, no entity is able to accurately and consistently predict future market activities.
Additionally, please be aware that past performance is not a guide to the future performance of any investment, and that the performance results and historical information provided displayed herein may have been adversely or favorably impacted by events and economic conditions that will not prevail in the future. Therefore, it should not be inferred that these results are indicative of the future performance of any strategy, index, fund, manager or group of managers.
The graphs and tables making up this report have been based on unaudited, third-party data and performance information provided to us by one or more commercial databases. While we believe this information to be reliable, Saxon Financial Group bears no responsibility whatsoever for any errors or omissions. Index benchmarks contained in this report are provided so that performance can be compared with the performance of well-known and widely recognized indices. Index results assume the re-investment of all dividends and interest. Moreover, the information provided is not intended to be, and should not be construed as, investment, legal or tax advice. Nothing contained herein should be construed as a recommendation or advice to purchase or sell any security, investment, or portfolio allocation. This presentation is not meant as a general guide to investing, or as a source of any specific investment recommendations, and makes no implied or express recommendations concerning the manner in which any client’s accounts should or would be handled, as appropriate investment decisions depend upon the client’s specific investment objectives.
Terms of Use
This report is intended solely for the use of its recipient. There is a fee associated with the access to this report and the information and materials presented herein. Re-distribution or republication of this report and its contents are prohibited. Expert use is implied. Saxon Interests, Inc. is a registered investment adviser with the Securities and Exchange Commission; registration does not imply a certain level of skill or training. For more detail, including information about Saxon’s business practices and conflicts identified, please refer to Saxon Financial Group’s Form ADV Part 2a and Form CRS at: https://www.saxonfinancialgroup.com
Performance Disclosures
All market pricing and performance data from Bloomberg, unless otherwise cited. Asset class and sector performance are gross of fees unless otherwise indicated.
Asset Class Definitions
Asset class performance was measured using the following benchmarks: U.S. Large Cap Stocks: S&P 500 TR Index; U.S. Small & Micro Cap: Russell 2000 TR Index; Intl Dev Large Cap Stocks: MSCI EAFE GR Index; Emerging & Frontier Market Stocks: MSCI Emerging Markets GR Index; U.S. Interm-Term Muni Bonds: Bloomberg 1-10 (1-12 Yr) Muni Bond TR Index; U.S. Interm-Term Bonds: Bloomberg U.S. Aggregate Bond TR Index; U.S. High Yield Bonds: Bloomberg U.S. Corporate High Yield TR Index; U.S. Bank Loans: S&P/LSTA U.S. Leveraged Loan Index; Intl Developed Bonds: Bloomberg Global Aggregate ex-U.S. Index; Emerging & Frontier Market Bonds: JPMorgan EMBI Global Diversified TR Index; U.S. REITs: MSCI U.S. REIT GR Index, Ex U.S. Real Estate Securities: S&P Global Ex-U.S. Property TR Index; Commodity Futures: Bloomberg Commodity TR Index; Midstream Energy: Alerian MLP TR Index; Gold: LBMA Gold Price, U.S. 60/40: 60% S&P 500 TR Index; 40% Bloomberg U.S. Aggregate Bond TR Index; Global 60/40: 60% MSCI ACWI GR Index; 40% Bloomberg Global Aggregate Bond TR Index.
Citations
1. BEA: U.S. Bureau of Economic Analysis (BEA)
2. Bureau of Labor Statistics: Current Employment Statistics – CES (National) : U.S. Bureau of Labor Statistics
3. U.S. Census Bureau: NRC – Data
4. The Conference Board: US Consumer Confidence
5. ISM: ISM® PMI® Reports
6. FactSet: FactSet Earnings Insight
7. NVIDIA: NVIDIA Corporation – NVIDIA 2nd Quarter FY27 Financial Results
8. Salesforce: Q2 FY27 Quarterly Investor Deck
9. Kansas City Fed: Jackson Hole Economic Policy Symposium Through the Years – Federal Reserve Bank of Kansas City
10. CNBC: Powell comments fuel 1,000-point market rout Friday as stocks slide for a second week
11. Federal Reserve: Speech by Chair Powell on new economic challenges and the Fed’s monetary policy review – Federal Reserve Board
12. Federal Reserve: Keynote remarks by Chairman Warsh at the 2026 Jackson Hole Economic Policy Symposium – Federal Reserve Board
13. New York Fed: The Implementation of Reserve Management Purchases to Maintain Ample Reserves
14. New York Fed: Treasury Securities Operational Details – FEDERAL RESERVE BANK of NEW YORK
15. CME Group: FedWatch – CME Group
16. Federal Reserve: Transcript of Chairman Warsh’s Press Conference — July 29, 2026
17. CNBC: CNBC Exclusive: Transcript: U.S. Treasury Secretary Scott Bessent Speaks with CNBC’s Sara Eisen on “Squawk on the Street” Today
18. U.S. Department of the Treasury: Treasury Announces Increased Sizes of Nominal Long-End Liquidity Support Buybacks Beginning September 9 | U.S. Department of the Treasury
Contact us
Get Started Today
Take control of your financial future with confidence. Contact Saxon Financial Group to schedule your consultation and learn how we can tailor a financial plan around your unique needs. Together, we’ll guide you down the most strategic path to achieving financial security and peace of mind.


Tell us how we can help you today