Overview
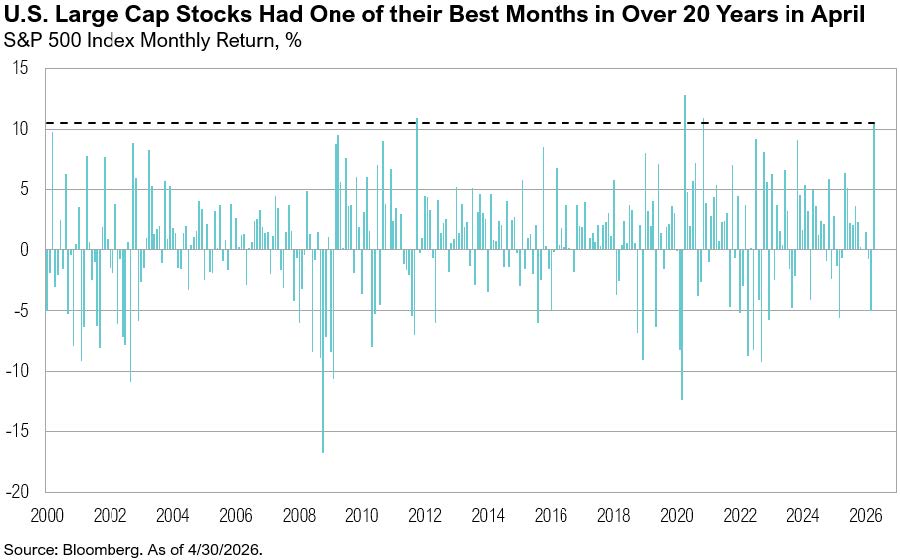
Despite continued geopolitical uncertainty U.S. large-cap stocks, represented by the S&P 500 Index, rose 11%, achieving the fourth-best month since January 2000. The small-cap Russell 2000 Index gained an impressive 12%. U.S. intermediate-term bonds, proxied by the Bloomberg U.S. Aggregate Bond Index, were essentially flat, up 0.1%.
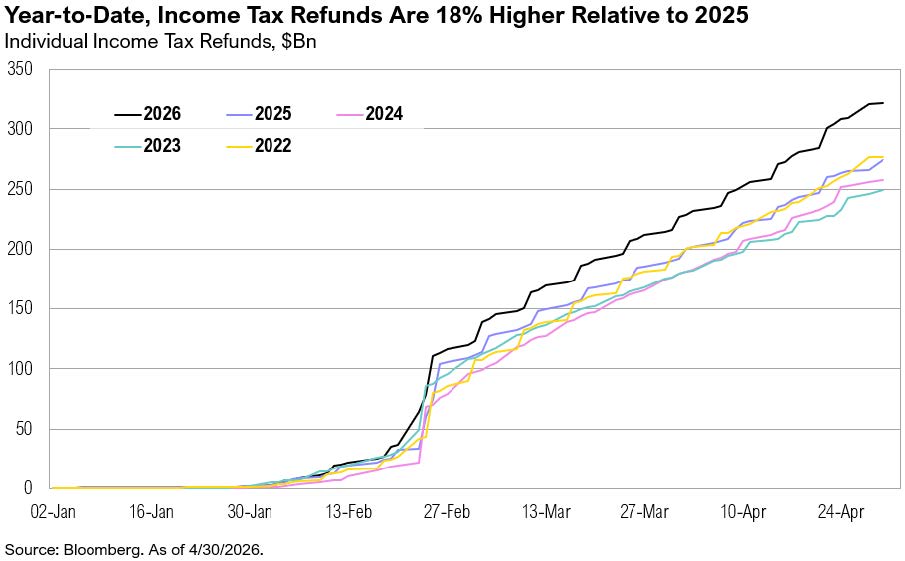
Recent U.S. economic data has highlighted the resilience of the U.S. consumer. Higher-than-usual tax refunds (with the total amount refunded—$313 billion—18% higher than 2025 year-to-date) supported spending despite rising fuel prices.1 Personal spending increased by 0.9% in March, marking the highest monthly print in at least three years.2 The personal saving rate declined to 3.6% in March, marking the lowest reading since November 2022.3
As expected, the Federal Reserve held rates steady at its April 29 Federal Open Market Committee meeting, and the policy rate has remained unchanged at 3.50%–3.75% since December 2025. The meeting marked the final one chaired by Jerome Powell, who will remain a voting governor for the foreseeable future. (His term ends in January 2028, but he has not yet confirmed how long he will stay.)4 The Department of Justice dropped its investigation into Powell on April 24, clearing a key obstacle to Kevin Warsh’s confirmation. Senator Thom Thillis ultimately provided the deciding vote, and Warsh is expected to begin his four-year term on May 15, pending final Senate approval.5
Kevin Warsh appeared before the Senate Banking Committee on April 21. At the hearing, Warsh outlined three priorities: refocusing the Fed on its dual mandate, adopting a new metric to measure inflation, and reducing reliance on tools such as quantitative easing and forward guidance.6 He emphasized trimmed-mean inflation, which excludes extreme price moves each period to better capture underlying trends.7
This is consistent with past Fed practice. Different regimes have shifted preferred metrics over time, from CPI under Arthur Burns and Paul Volcker, to PCE under Alan Greenspan, and more recently references to “supercore” PCE under Powell, which excludes housing.8 Warsh described AI as “the most productivity-enhancing wave of our lifetimes” and indicated that technology developments could exert downward pressure on inflation.9 If AI does meaningfully boost productivity, it may act as a disinflationary force, creating room for lower interest rates—or at least reducing the need for further hikes. He noted, “The Fed needs to get access to better data and to dig deeper into the productivity possibilities.” Despite the transition to a new chair, particularly one who has recently made clear his preference for lower interest rates, markets are not pricing in any rate changes in 2026.10
Houston, Do We Have a Problem?
On April 1, NASA’s Artemis II mission launched from the Kennedy Space Center and successfully splashed down in the Pacific Ocean on April 10, marking the first human crew to orbit the moon since the Apollo 13 mission in 1970. At their farthest point, the Artemis crew traveled 252,756 miles from Earth, breaking the deep-space record held by the Apollo 13 astronauts for over 50 years.11

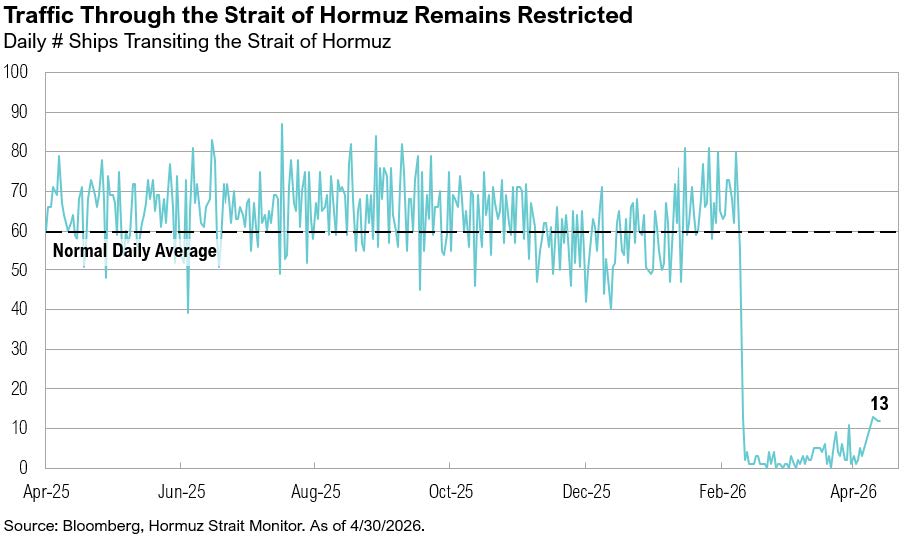
The phrase “Houston, we have a problem” was coined on April 14, 1970, when an oxygen tank ruptured aboard Apollo 13 roughly 20,000 miles from earth.12 Exactly 56 years later (to the month) the phrase fits again. The failure this time isn’t an oxygen tank deep in space, but rather oil tankers roughly 7,000 miles from Texas in the Strait of Hormuz. For two months, traffic through the Strait of Hormuz, which handles roughly 20% of global oil and 25% of global LNG on a daily basis, has been restricted, and now only about 8% of normal daily volumes pass through.13
On February 28, a coordinated strike by U.S. and Israeli forces targeted Iran’s leadership, military command centers, air defense systems, missile launch sites, naval facilities, and elements of its nuclear and missile infrastructure. Iran retaliated with a series of missile and drone attacks across the region, including strikes on Gulf energy infrastructure across Qatar, Saudi Arabia, the United Arab Emirates, and Bahrain.14 The conflict led to a de facto closure of the Strait of Hormuz, severely constraining global oil flows. The U.S. Energy Information Administration (EIA) has estimated that around 9 million barrels of oil per day have been shut in (crude production that is temporarily halted or unable to reach market due to operational, logistical, or geopolitical disruptions).15
Throughout April, markets adjusted their timeline for the conflict. The December 2026 price per barrel of Brent crude (the seaborne crude oil global benchmark and most exposed to disruptions in the Strait of Hormuz) rose from $78 on April 1 to $88 on April 30. At the same time, the gap between Brent prices and West Texas Intermediate crude (or WTI, which is inland and less exposed to global price fluctuations) ended April at the widest level since the start of the conflict. Under normal circumstances, the gap would shrink if the disruption were temporary (or viewed as such), and the move throughout April indicates markets are increasingly doubtful about a lasting ceasefire and peace resolution, instead pricing in continued disruption through the end of 2026. By early May, markets had reversed much of the April moves on reports that the U.S. and Iran were making progress on a memorandum of understanding that would lead to a final resolution of the conflict.16 Iran reportedly proposed opening the Strait of Hormuz and ending the U.S. Naval blockade first, but the issue of its nuclear program lingers. WTI crude prices dropped to $95 on May 8, and December prices eased from a high of $84 to $79, while Brent crude prices dropped to $101. December Brent prices dropped from a high of $91 on May 4 to $87 on May 8.
Despite the U.S. being more energy dependent than at any other time in its history, the pass-through to consumers is building. Energy accounts for between 7% and 8% of inflation, and it has further indirect effects on inflation via transportation, logistics, and production costs, creating broader but more gradual second-round inflationary pressures across goods and services.17 National average gas prices ended April at $4.40 per gallon, the highest since July 2022.18 Jet fuel, which represents between 20% and 35% of an airline’s operating expenses, has roughly doubled.19 United Airlines has cut its schedule by around 5% through September, trimming lower-margin routes, while Delta Air Lines has reduced routes from JFK, Detroit, and Boston.20,21 U.S. airlines have reported that they will need to pass higher fuel costs to customers via fares and fees and may reduce capacity, though cuts remain less severe than in Europe and Asia.21,22 Many European and Asian economies are much more dependent on foreign energy than the U.S. For example, Japan imports nearly 90% of its oil from the Middle East, and Germany produces almost no energy domestically, with around 98% of its energy sources imported.23,24 The longer the conflict plays out, the greater the risk to global growth, especially oil-dependent sectors and economies.
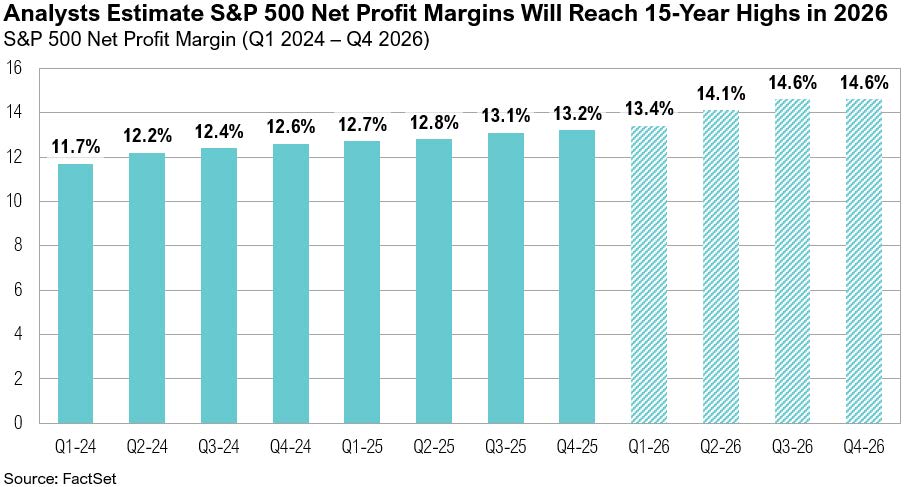
Meanwhile, U.S. corporate fundamentals remain strong. Over 60% of companies in the S&P 500 have reported first-quarter 2026 earnings results, and net profit margins are on track for a 15-year high of 13.4% and are expected to rise to 14.6% by year-end.25,26 As earnings season has progressed, growth expectations for the first quarter have jumped from 13% at the end of March to 27% by the end of April—the fastest pace since 2021.26 Earnings growth expectations for 2026 rose from 17% to 21% over the month, with the energy (45%), information technology (39%) and materials (36%) sectors expected to be the top contributors.26
Four of the Magnificent Seven reported first-quarter earnings on April 29, showing mixed results that highlighted both strong growth and rising investment pressure. Meta fell 10% after raising capital expenditure guidance by $10 billion, underscoring an urgent push to secure compute capacity. It also announced plans to cut 10% of its workforce to offset heavy AI spending.27 In contrast, Alphabet rose 7% on strong cloud performance and early TPU (Tensor Processing Unit, a custom-built chip designed to process AI and machine learning tasks much faster and more efficiently than a regular chip) monetization, while Amazon gained 4% as web services grew 28% year-over-year and delivered its largest fourth-quarter to first-quarter revenue increase on record.28,29 Microsoft shares slipped 4%, reflecting elevated AI investment and pressures in its core software business.30 Earlier in April, Microsoft offered voluntary retirement to 7% of its U.S. workforce.31 Amazon, Alphabet, Meta, and Microsoft are each projected to spend more than $700 billion in 2026 on capex, more than the prior two years combined.32 On the back of Alphabet’s and Meta’s results, the communication services sector experienced revised first-quarter earnings expectations of -4% to 53%.26 Similarly, consumer discretionary earnings expectations jumped from 2% to 39%, driven by Amazon.26
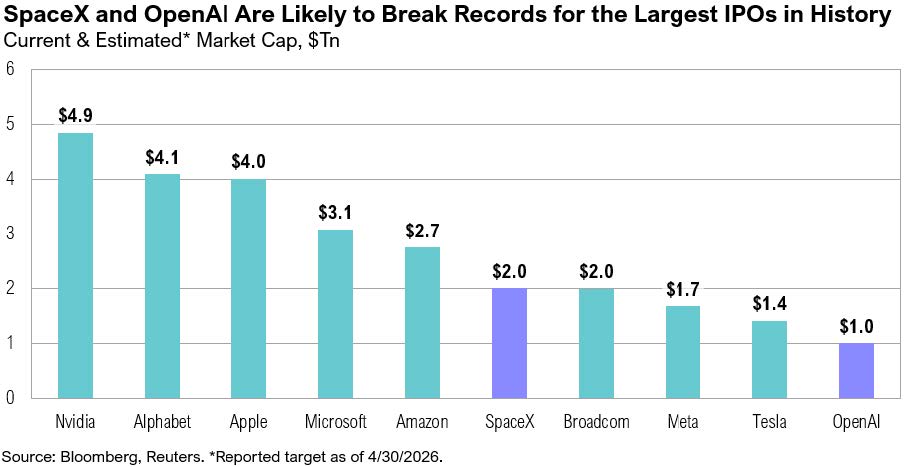
There are now over 1,700 unicorns (private companies worth more than $1 billion) globally.33 Six of the 10 most valuable unicorns are based in the U.S., and the top two, SpaceX and OpenAI, are planning to go public. With an estimated market cap of $2 trillion and $1 trillion respectively, SpaceX and OpenAI will both likely break records for the largest initial public offerings in history, a record currently held by Saudi Aramco, which listed in December 2019 with a market cap of $1.7 trillion.34,35,36 SpaceX is reportedly targeting a June 2026 listing. The S&P 500 Index and Nasdaq are both considering concessions, such as waiving the typical seasoning period, to accelerate its inclusion in their indices.37 Nasdaq is also reportedly planning to allocate up to 30% of shares to retail investors—well above the norm—reflecting Elon Musk’s “fan-friendly” approach.38 OpenAI has not confirmed timing but is widely expected to be listed in late 2026 or 2027.39
Markets
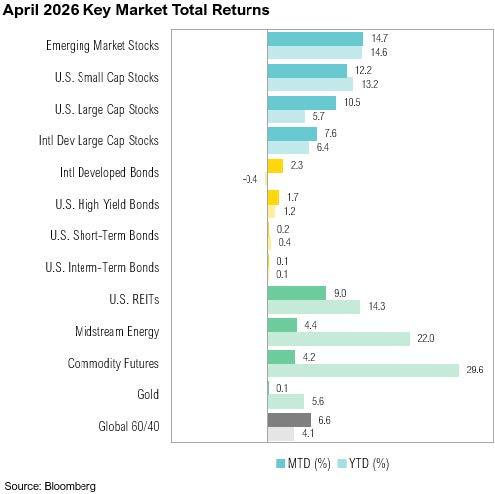
Despite ongoing geopolitical uncertainty, markets fared well in April. Notably, emerging markets were the best performing of all major asset classes, ending the month up 14.7%. U.S. small-cap stocks gained a notable 12%, marginally outperforming large-cap peers, which ended the month up 10.5%. Developed market large-cap stocks ended the month up 7.6%. U.S. intermediate-term bonds ended April flat, up 0.1%.
Looking Forward
By early May, reports suggested that the U.S. and Iran were making progress toward a comprehensive agreement that would end the conflict. (President Trump did, yet again, threaten escalation if an agreement cannot be reached.)40 The future of Iran’s nuclear program and control over the Strait of Hormuz remain key sticking points in negotiations. By the end of the first week of May, no further progress had been made.
Some markets are flying high, but the fuel gauge is one of the key things to watch. If oil stays elevated, second-order effects such as fertilizer, fuel, freight, and logistics costs could broaden inflation and eventually feed into food and goods prices. For now, current signals still point to a resilient U.S. economy, supported by strong corporate earnings and continued AI investment.
Disclosures
The material shown is for informational purposes only. Any opinions expressed are current only as of the time made and are subject to change without notice. This report may include estimates, projections or other forward-looking statements; however, forward-looking statements are subject to numerous assumptions, risks, and uncertainties, and actual results may differ materially from those anticipated in forward-looking statements. As a practical matter, no entity is able to accurately and consistently predict future market activities
Additionally, please be aware that past performance is not a guide to the future performance of any investment, and that the performance results and historical information provided displayed herein may have been adversely or favorably impacted by events and economic conditions that will not prevail in the future. Therefore, it should not be inferred that these results are indicative of the future performance of any strategy, index, fund, manager or group of managers.
The graphs and tables making up this report have been based on unaudited, third-party data and performance information provided to us by one or more commercial databases. While we believe this information to be reliable, Saxon Financial Group bears no responsibility whatsoever for any errors or omissions. Index benchmarks contained in this report are provided so that performance can be compared with the performance of well-known and widely recognized indices. Index results assume the re-investment of all dividends and interest. Moreover, the information provided is not intended to be, and should not be construed as, investment, legal or tax advice. Nothing contained herein should be construed as a recommendation or advice to purchase or sell any security, investment, or portfolio allocation. This presentation is not meant as a general guide to investing, or as a source of any specific investment recommendations, and makes no implied or express recommendations concerning the manner in which any client’s accounts should or would be handled, as appropriate investment decisions depend upon the client’s specific investment objectives.
Terms of Use
This report is intended solely for the use of its recipient. There is a fee associated with the access to this report and the information and materials presented herein. Re-distribution or republication of this report and its contents are prohibited. Expert use is implied. Saxon Interests, Inc. is a registered investment adviser with the Securities and Exchange Commission; registration does not imply a certain level of skill or training. For more detail, including information about Saxon’s business practices and conflicts identified, please refer to Saxon Financial Group’s Form ADV Part 2a and Form CRS at: https://www.saxonfinancialgroup.com
Performance Disclosures
All market pricing and performance data from Bloomberg, unless otherwise cited. Asset class and sector performance are gross of fees unless otherwise indicated.
Asset Class Definitions
Asset class performance was measured using the following benchmarks: U.S. Large Cap Stocks: S&P 500 TR Index; U.S. Small & Micro Cap: Russell 2000 TR Index; Intl Dev Large Cap Stocks: MSCI EAFE GR Index; Emerging & Frontier Market Stocks: MSCI Emerging Markets GR Index; U.S. Interm-Term Muni Bonds: Bloomberg 1-10 (1-12 Yr) Muni Bond TR Index; U.S. Interm-Term Bonds: Bloomberg U.S. Aggregate Bond TR Index; U.S. High Yield Bonds: Bloomberg U.S. Corporate High Yield TR Index; U.S. Bank Loans: S&P/LSTA U.S. Leveraged Loan Index; Intl Developed Bonds: Bloomberg Global Aggregate ex-U.S. Index; Emerging & Frontier Market Bonds: JPMorgan EMBI Global Diversified TR Index; U.S. REITs: MSCI U.S. REIT GR Index, Ex U.S. Real Estate Securities: S&P Global Ex-U.S. Property TR Index; Commodity Futures: Bloomberg Commodity TR Index; Midstream Energy: Alerian MLP TR Index; Gold: LBMA Gold Price, U.S. 60/40: 60% S&P 500 TR Index; 40% Bloomberg U.S. Aggregate Bond TR Index; Global 60/40: 60% MSCI ACWI GR Index; 40% Bloomberg Global Aggregate Bond TR Index.
Citations
1. IRS: https://www.irs.gov/newsroom/filing-season-statistics-for-week-ending-april-24-2026
2. Bureau of Economic Analysis: https://www.bea.gov/data/consumer-spending/main
3. Federal Reserve Bank of St. Louis: https://fred.stlouisfed.org/series/PSAVERT
4. Wall Street Journal: https://www.wsj.com/economy/central-banking/jerome-powell-federal-reserve-decision-89f4ff22
5. CNBC: https://www.cnbc.com/2026/04/24/fed-powell-doj-warsh-trump.html
6. United States Senate Committee on Banking, Housing, and Urban Affairs: https://www.banking.senate.gov/hearings/04/14/2026/nomination-hearing
7. Reuters: https://www.reuters.com/markets/us/warshs-quest-better-inflation-data-is-well-worn-difficult-pursuit-fed-2026-04-24/
8. CME Group: https://www.cmegroup.com/openmarkets/equity-index/2025/Why-the-Fed-Prefers-PCE-Over-CPI-for-Inflation-Insights.html
9. Charles Schwab: https://www.schwab.com/learn/story/fed-watch-can-ai-productivity-gain-cut-inflation
10. CME FedWatch: https://www.cmegroup.com/markets/interest-rates/cme-fedwatch-tool.html
11. NASA: https://www.nasa.gov/news-release/nasa-welcomes-record-setting-artemis-ii-moonfarers-back-to-earth/
12. NASA: https://www.nasa.gov/history/houston-weve-had-a-problem/
13. Hormuz Strait Monitor: https://hormuzstraitmonitor.com/
14. Reuters: https://www.reuters.com/business/aerospace-defense/top-us-general-outlines-initial-timeline-us-military-operation-iran-2026-03-02/
15. U.S. Energy Information Administration: https://www.eia.gov/outlooks/steo/
16. Axios: https://www.axios.com/2026/05/06/iran-us-deal-one-page-memo
17. Bureau of Labor Statistics: https://www.bls.gov/cpi/tables/relative-importance/2025.htm
18. AAA: https://gasprices.aaa.com/
19. IATA: https://www.iata.org/en/publications/economics/fuel-monitor/
20. Travel Market Report: https://www.travelmarketreport.com/air/articles/delta-air-lines-cuts-routes-out-of-new-york-boston-and-more-for-summer
21. Flight Global: https://www.flightglobal.com/archive/2026/04/big-four-us-airlines-cut-flights-and-raise-fares-as-fuel-shocks-squeeze-profits/
22. Reuters: https://www.reuters.com/business/aerospace-defense/airlines-face-fare-dilemma-fuel-spike-threatens-travel-demand-2026-03-30/
23. IEA: https://www.iea.org/data-and-statistics/data-tools/reliance-on-middle-east-oil-and-gas-supplies-by-country
24. World Bank: https://data.worldbank.org/indicator/EG.IMP.CONS.ZS?locations=DE
25. FactSet: https://advantage.factset.com/hubfs/Website/Resources%20Section/Research%20Desk/Earnings%20Insight/EarningsInsight_042426.pdf
26. FactSet: https://advantage.factset.com/hubfs/Website/Resources%20Section/Research%20Desk/Earnings%20Insight/EarningsInsight_050126.pdf
27. CNBC: https://www.cnbc.com/2026/04/29/meta-q1-earnings-report-2026.html
28. Reuters: https://www.reuters.com/business/alphabets-cloud-unit-beats-quarterly-revenue-estimates-strong-ai-demand-2026-04-29/
29. CNBC: https://www.cnbc.com/2026/04/29/amazon-amzn-q1-earnings-report-2026.html
30. CNBC: https://www.cnbc.com/2026/04/29/microsoft-msft-q3-earnings-report-2026.html
31. Wall Street Journal: https://www.wsj.com/tech/microsoft-offers-buyouts-to-7-of-workforce-755b8534
32. Bloomberg: https://www.bloomberg.com/news/articles/2026-04-30/us-big-tech-ratchets-up-ai-spending-past-700-billion-this-year
33. BestBrokers: https://www.bestbrokers.com/forex-brokers/most-valuable-unicorn-startups/
34. Bloomberg: https://www.bloomberg.com/news/articles/2026-04-02/spacex-is-said-to-target-more-than-2-trillion-valuation-in-ipo
35. Bloomberg: https://www.bloomberg.com/news/articles/2025-10-29/openai-could-target-1-trillion-value-in-ipo-reuters-says
36. Wall Street Journal: https://www.wsj.com/articles/aramco-shares-rise-10-after-worlds-biggest-ipo-11576050635
37. Wall Street Journal: https://www.wsj.com/finance/stocks/stock-indexes-are-contorting-themselves-to-include-spacex-and-openai-92136b13
38. Reuters: https://www.reuters.com/business/finance/musk-rewrites-ipo-playbook-with-large-slice-spacex-stock-retail-investors-source-2026-03-26/
39. Reuters: https://www.reuters.com/business/openai-lays-groundwork-juggernaut-ipo-up-1-trillion-valuation-2025-10-29/
40. Axios: https://www.axios.com/2026/05/06/trump-iran-war-deal-framework-response
Contact us
Get Started Today
Take control of your financial future with confidence. Contact Saxon Financial Group to schedule your consultation and learn how we can tailor a financial plan around your unique needs. Together, we’ll guide you down the most strategic path to achieving financial security and peace of mind.
Tell us how we can help you today