Overview
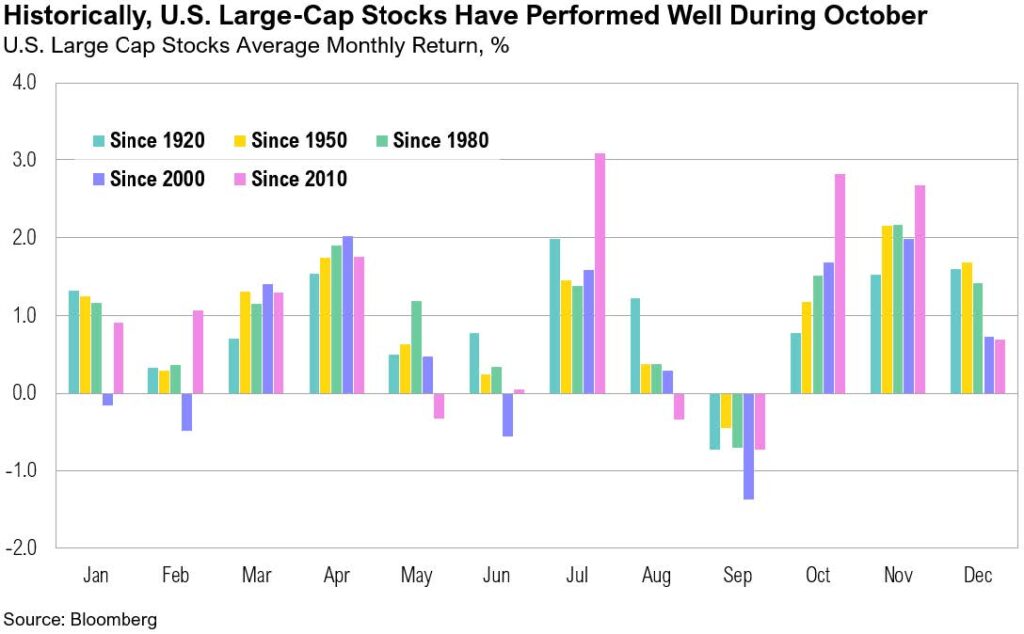
U.S. large-cap stocks, as measured by the S&P 500 index, gained 2.3% in October. Since 2000, October returns for U.S. large-cap stocks have averaged 1.7%, making 2025 a year of relatively strong monthly performance. The Russell 2000, an index of U.S. small-cap stocks, gained 1.8% over the month. U.S. intermediate-term bonds, as proxied by the Bloomberg U.S. Aggregate Bond Index, finished October up 0.6%.
Trick or Treat
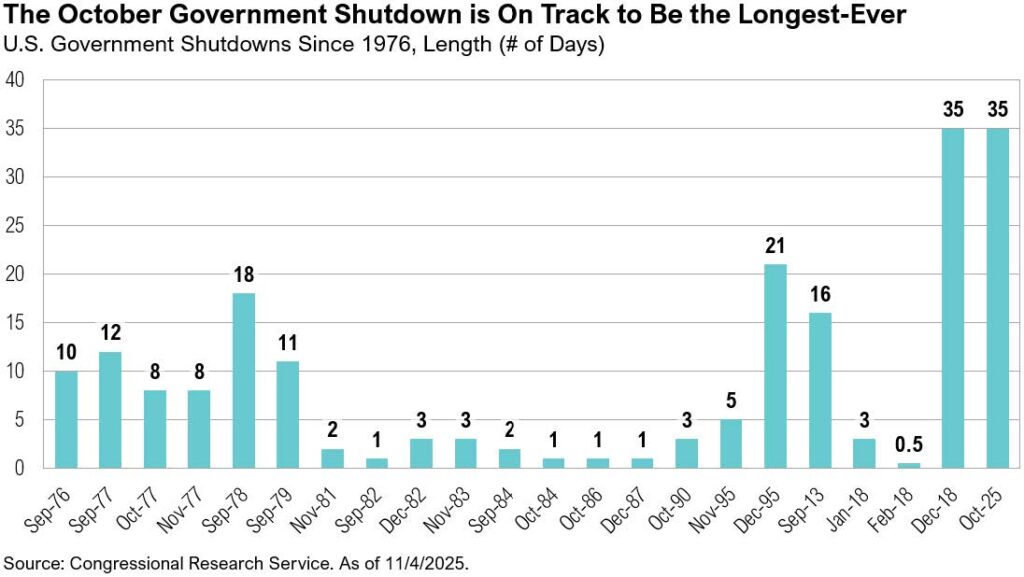
The U.S. government shutdown, triggered by unresolved budget disputes, took effect on October 1. As a result, certain government services were suspended, and roughly 40% of the federal workforce (about 750,000 employees) were furloughed without pay. The dispute centered on disagreements over tax credits, Medicaid funding, and agency budgets. The Senate was unable to reach an agreement despite multiple votes. This marks the 21st funding gap and the eleventh government shutdown in modern U.S. history. Betting markets expect it to be the longest shutdown in U.S. history.1,2 The shutdown has delayed and disrupted key economic data releases from agencies such as the Bureau of Labor Statistics, the Bureau of Economic Analysis, and the Department of the Treasury, leaving markets, investors, and the Federal Reserve in the dark.
The September inflation report was the only official economic release permitted during the shutdown, as it serves as the benchmark for cost-of-living adjustments (COLA) in benefit payments.3 It showed headline inflation rising from 2.9% to 3.0% year-over-year and reaching the highest level since May 2024.4 Shelter costs, while still elevated at 3.6% year-over-year, increased at their slowest pace since November 2021.4 Overall, headline inflation has remained sticky, averaging 3.0% since June 2023.
Although official Bureau of Labor Statistics payroll and other labor market data have been suspended, state-level initial jobless claims continue to be reported throughout the government shutdown. According to J.P. Morgan, aggregated state-level initial claims have remained steady, easing from around 219,000 to 205,000 in the week ending October 25.5 For context, the last officially reported national figure was 218,000 for the week ending September 20.6 During the October 29 Federal Open Market Committee (FOMC) meeting, Federal Reserve Chair Jerome Powell noted that: “We’ll have a picture of what’s going on in the labor market. And the fact that we’re not seeing an uptick in claims, or a downtick really in openings, suggests that you’re seeing maybe continued very gradual cooling [of the labor market], but nothing more than that. So that does give you some comfort.”7
With inflation back at 3% and the labor market showing signs of only “very gradual cooling,” the Federal Reserve cut interest rates at the October 29 FOMC meeting, bringing rates to the range of 3.75% to 4.0%.7 Fed Chair Powell sought to temper expectations for a follow-up cut in December by saying that a “further reduction in the policy rate at the December meeting is not a forgone conclusion—far from it.”7 Nevertheless, market-implied probabilities at the end of October still placed the likelihood of a December cut at 70%.8
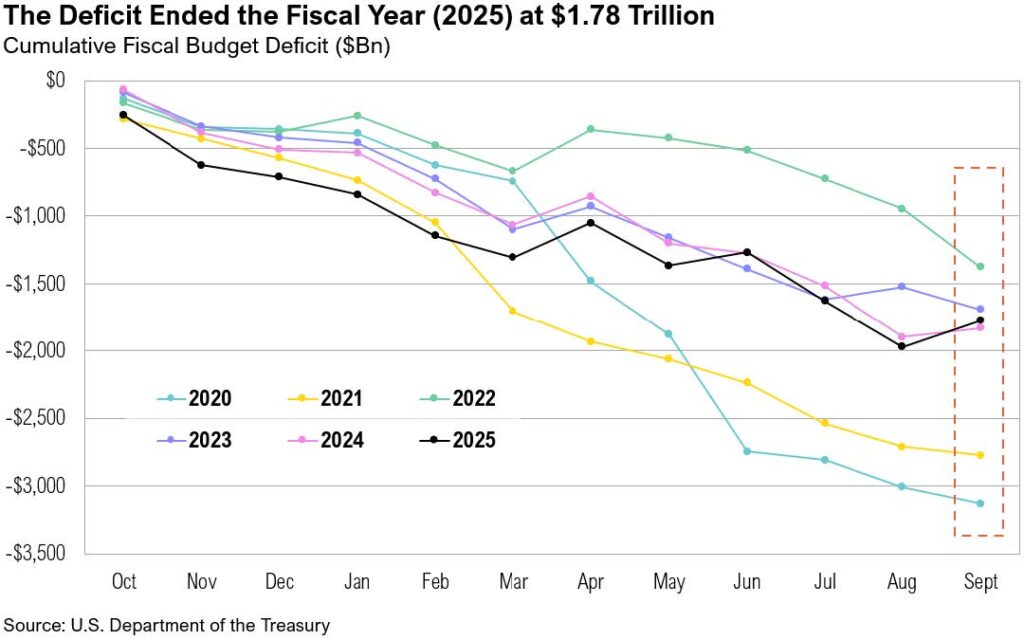
Monetary policy will likely remain supportive, particularly since inflation has hovered between 3.7% and 2.4% for the past 27 months—chronically above the Fed’s 2% inflation target. Further, lower interest rates provide an immediate benefit to the ever-present U.S. fiscal debt burden. On October 16, the full fiscal 2025-year Treasury statement was released. It showed the fiscal deficit reaching $1.76 trillion in 2025, a marginal improvement over the $1.83 trillion deficit racked up in 2024.9 The modest improvement was largely due to a boost in tariff revenues: $30 billion was collected in September, which contributed to the largest September surplus on record of $197.9 billion.9,10 On November 5, the Trump administration headed to the Supreme Court to defend the legality of the April 2 “Liberation Day” tariffs.11 If the court rules them invalid (pulling a “trick,” not a “treat” for the administration), billions in tariff revenue may have to be refunded to trade partners. Net interest payments—which would benefit from lower interest rates—rose to $970 billion in the 2025 fiscal year, up from $882 billion in 2024.9
While markets (and the Fed) may have been left in the dark without any economic data to guide expectations and policy views (thus complicating both investment decisions and the Fed’s future interest rate deliberations), the third-quarter earnings season has thus far been a treat for most investors. As of the end of October, more than 60% of companies had reported results, and 83% of companies exceeded expectations.12
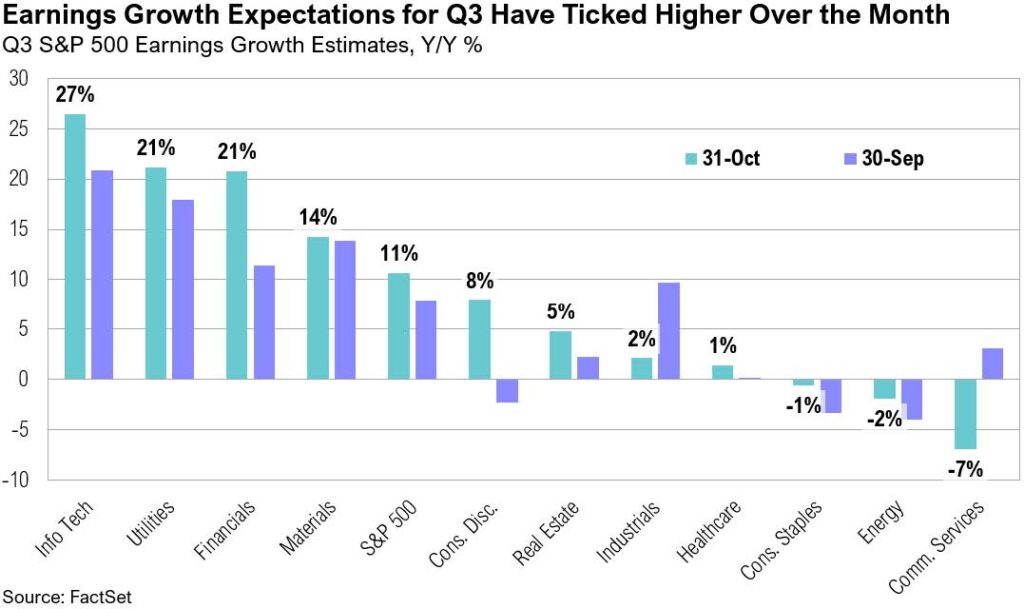
Earnings growth expectations for the third quarter notably improved through October, rising from 8% at the end of September to 11% by month-end. Information technology (+27%) and utilities (+21%) are expected to drive overall earnings growth.12 Despite beating expectations, Meta’s share price fell more than 10% after it recorded a one-time, non-cash income tax charge related to the implementation of the “One Big Beautiful Bill.” This charge reduced the company’s earnings per share, which in turn pulled down the communication services sector’s third-quarter earnings expectations from +3% to -7%.12 Excluding Meta, the sector would be showing a 13% year-over-year increase.12
Looking ahead, full-year S&P 500 earnings growth expectations continue to edge higher, rising from 10.7% at the end of September to 11.2% by the end of October.12 Full-year 2026 earnings for the S&P 500 are currently projected to rise by 14%. U.S. small-cap stocks, which have gained 12% year to date, are also expected to see strong earnings growth. Russell 2000 earnings are expected to rise by 27% in 2025, and by a notable 40% in 2026.
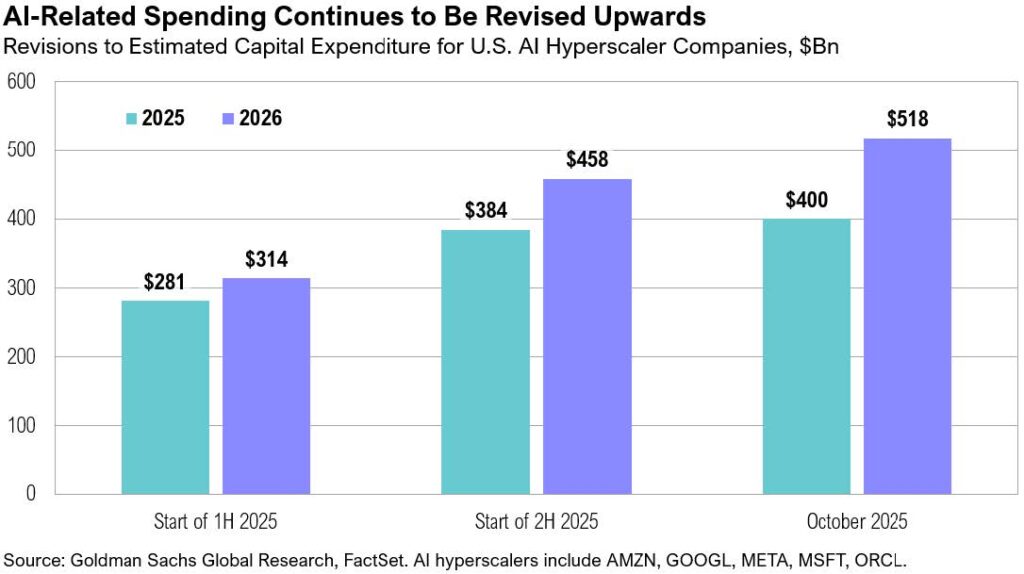
Meta, Amazon, Microsoft, and Alphabet all reported earnings in October. Artificial intelligence–related capital expenditures (capex) remained a dominant theme across earnings calls, and all four companies signaled plans to increase their spending in 2026. Together, Meta, Amazon, Microsoft, and Alphabet—some of the largest U.S. AI hyperscalers—reported a combined $100 billion in capex during the third quarter of 2025 and an estimated $384 billion year to date. Looking ahead, these companies show no signs of slowing their investments. Meta’s management noted that their “current expectation is that capex dollar growth will be notably larger in 2026 than 2025,” while Alphabet executives said they “expect a significant increase in capex.”13,14 Similarly, Amazon stated in its earnings call that it “expects full-year cash capex to be approximately $126 billion in 2025, and that amount will increase in 2026.”15 Microsoft’s CFO, Amy Hood, added that “…total spend will increase sequentially, and we now expect the full-year 2026 growth rate to be higher than 2025.”16
Other insights from company earnings calls have thus far revealed interesting consumer spending-related trends. Most notably, both Visa and Mastercard highlighted the resilience of consumers. According to Visa CFO Christopher Suh: “U.S. payments volume was up 8%…reflecting resilience in consumer spending. We saw a broad-based strength, including improvements in retail services and goods, travel, and fuel.”17
Mastercard CFO Sachin Mehra echoed a similar sentiment, pointing to healthy consumer spending across income cohorts: “What we’re seeing is continued steady growth, both across affluent and mass market, through in the U.S. through across the globe. So overall, the consumer continues to spend.”18

Markets
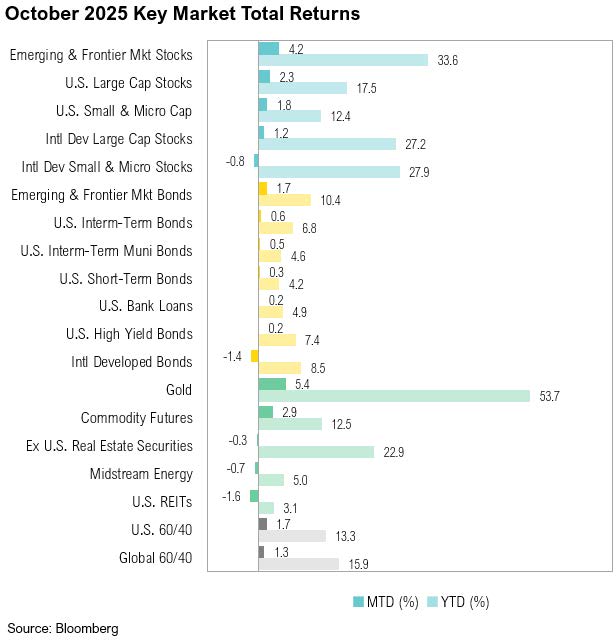
U.S. large-cap stocks ended October up 2.3%, outperforming foreign peers by 1.1% as international developed market stocks ended the month up 1.2%. U.S. small-cap stocks gained 1.8% over the month while developed market small-cap stocks ended October down 0.8%. Emerging market stocks gained 4.2%.
The 10-year Treasury yield eased to 3.95% on October 22. Then, after Fed Chair Powell’s post-FOMC press conference comment that a December interest rate cut was “far from” a forgone conclusion, it rose back above 4%, where it remained for the rest of the month. Despite credit concerns in the U.S. banking sector stemming from alleged fraud at two auto companies (Tricolor and First Brands), bank credit default swaps remained contained relative to history. In addition, high-yield spreads ended the month at 2.78%. These signs indicate that the developments were idiosyncratic and do not reflect broader systemic issues.
Gold, which remains a top performer year to date (gaining 54% since January), ended the month up 5.4%, and reached a new record high of $4,366 per ounce on October 20. After dropping to $56 per barrel, West Texas Intermediate (WTI) crude oil prices ended October back above $60 per barrel while national average gas prices eased to the lowest price for this time of year in five years.
At the end of October, U.S. President Trump held key trade talks with both Japan and China. The U.S. and Japan announced a $550 billion deal that will see Japanese investment in industries such as energy infrastructure, AI, and critical minerals.21 Japan has also committed to tariff adjustments and the opening of markets that benefit both countries. Meanwhile, the U.S.–China agreement marks a tactical truce that includes tariff reductions, a suspension of export controls on rare earths essential to U.S. industry, and resumed Chinese purchases of U.S. agricultural products.22 Although the U.S.–China deal provides breathing room to avoid supply chain disruption and trade damage, as well as raises hope for improved trade dialogue, it has been widely viewed as a tactical pause rather than a comprehensive solution to the trade imbalances between the two countries. The MSCI Japan Index ended October up 3.4% (up 25% year-to-date) while the MSCI China Index ended the month down 3.8% (up 36% year-to-date).
Looking Forward
While government shutdowns have historically had limited market impact, the duration of the current shutdown has intensified the sense of disruption and may be spurring consternation among investors. That said, its eventual resolution will likely calm markets and allow a vast amount of money to continue to flow from government coffers. Bond yields, a pivotal signal, are in a curious balance, caught between a softening labor and housing market on one side and continued elevated inflation on the other. Investors also need to consider the potential for the Fed to become increasingly supportive as we head into 2026. After the Fed cut rates at the October 29 FOMC meeting, Treasury Secretary Scott Bessent noted:
“The decision to cut rates by 25 basis points, I applaud. But the language that went with it tells me that this Fed is stuck in the past. Their inflation estimates have been terrible so far this year. They keep coming down, inflation keeps coming down, and their models are broken. And I’m just not sure what they’re thinking here in terms of signaling that they may not want to cut rates at the December meeting. They’ve got a lot to answer for, not only for this year but for many years past, both in their GDP estimates and their inflation estimates, which are consistently wrong. And we’re going to find a leader who is going to revamp the entire institution in terms of process and inner workings.”23
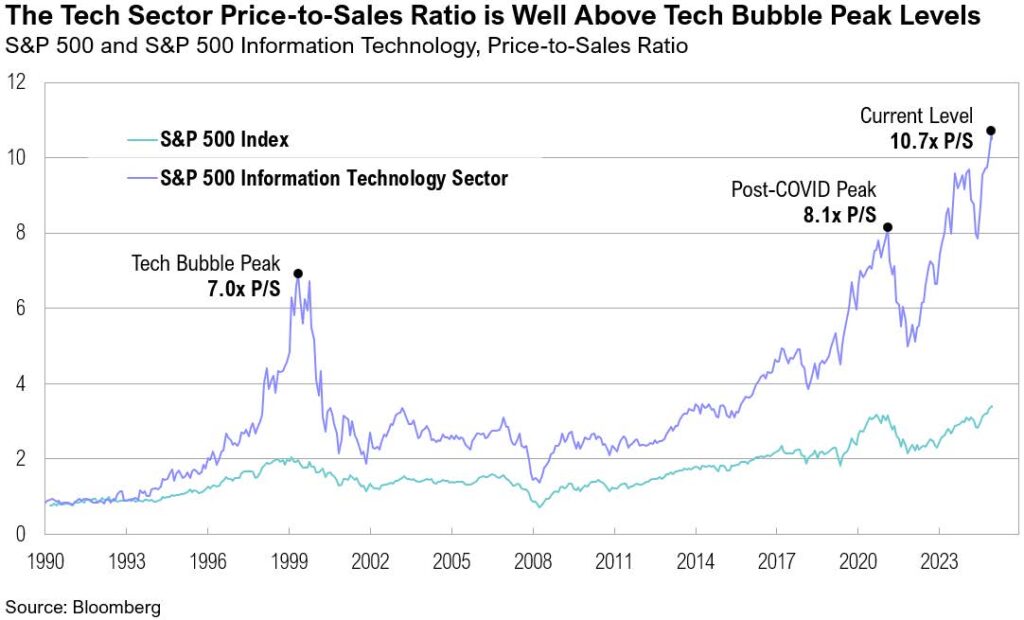
Artificial intelligence remains a dominant market theme, and there is a reasonable debate over whether current enthusiasm reflects a trick-or-treat, an AI bubble or a sustained transformational growth opportunity. On one hand, technology sector valuations keep climbing, and the price-to-sales (P/S) ratio ended October well above Tech Bubble levels. The S&P 500 information technology sector now trades at 10.7x sales, compared with a peak of 7.0x in the early 2000s.
On the other hand, when valuation is adjusted for earnings growth, the sector looks less extreme. Using one version of a PEG ratio—price-to-earnings divided by three-year trailing earnings growth—the sector stands at 1.4x versus roughly 4.1x at the height of the Tech Bubble. This oversimplified contrast doesn’t settle the debate, but it highlights one defining feature of the bull market: earnings growth remains key.
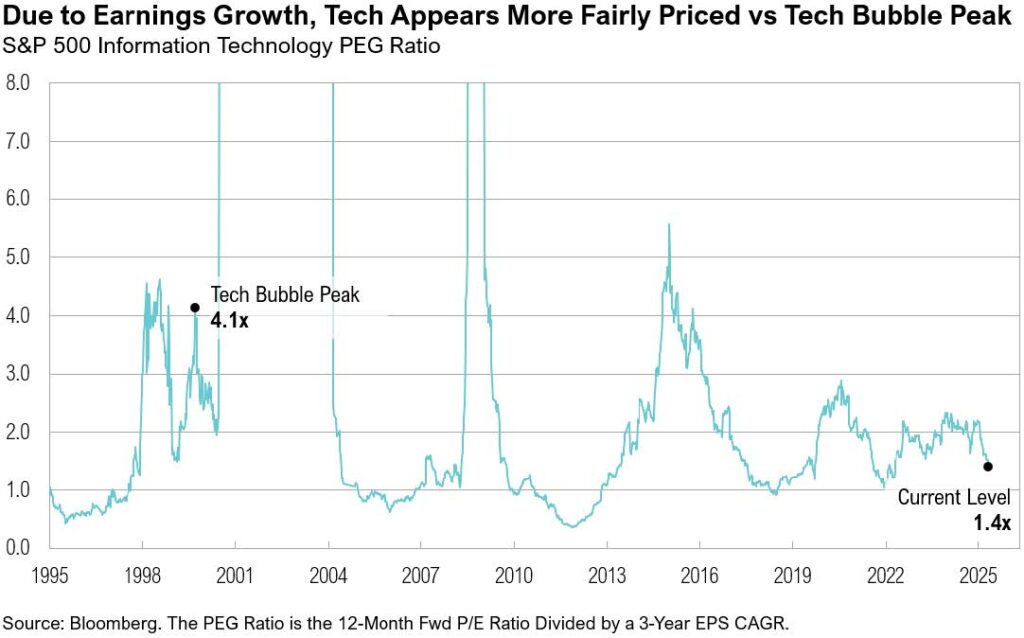
For the S&P 500, earnings per share (EPS) fell 1% year-over-year in 2023, rose 8% in 2024, and are projected to increase 14% in 2025 and 13% in 2026. In the information technology sector, EPS declined 0.6% in 2023, rebounded 18% in 2024, and is expected to surge 33% in 2025 and 23% in 2026.
While it is not guaranteed, continued earnings growth and the prospect of substantially easier policy should encourage investors to patiently stay the course, albeit in diversified portfolios.
Contact us
Get Started Today
Take control of your financial future with confidence. Contact Saxon Financial Group to schedule your consultation and learn how we can tailor a financial plan around your unique needs. Together, we’ll guide you down the most strategic path to achieving financial security and peace of mind.
Tell us how we can help you today
Disclosures
The material shown is for informational purposes only. Any opinions expressed are current only as of the time made and are subject to change without notice. This report may include estimates, projections or other forward-looking statements; however, forward-looking statements are subject to numerous assumptions, risks, and uncertainties, and actual results may differ materially from those anticipated in forward-looking statements. As a practical matter, no entity is able to accurately and consistently predict future market activities.
Additionally, please be aware that past performance is not a guide to the future performance of any investment, and that the performance results and historical information provided displayed herein may have been adversely or favorably impacted by events and economic conditions that will not prevail in the future. Therefore, it should not be inferred that these results are indicative of the future performance of any strategy, index, fund, manager or group of managers.
The graphs and tables making up this report have been based on unaudited, third-party data and performance information provided to us by one or more commercial databases. While we believe this information to be reliable, Saxon Financial Group bears no responsibility whatsoever for any errors or omissions. Index benchmarks contained in this report are provided so that performance can be compared with the performance of well-known and widely recognized indices. Index results assume the re-investment of all dividends and interest. Moreover, the information provided is not intended to be, and should not be construed as, investment, legal or tax advice. Nothing contained herein should be construed as a recommendation or advice to purchase or sell any security, investment, or portfolio allocation. This presentation is not meant as a general guide to investing, or as a source of any specific investment recommendations, and makes no implied or express recommendations concerning the manner in which any client’s accounts should or would be handled, as appropriate investment decisions depend upon the client’s specific investment objectives.
Terms of Use
This report is intended solely for the use of its recipient. There is a fee associated with the access to this report and the information and materials presented herein. Re-distribution or republication of this report and its contents are prohibited. Expert use is implied. Saxon Interests, Inc. is a registered investment adviser with the Securities and Exchange Commission; registration does not imply a certain level of skill or training. For more detail, including information about Saxon’s business practices and conflicts identified, please refer to Saxon Financial Group’s Form ADV Part 2a and Form CRS at: https://www.saxonfinancialgroup.com
Performance Disclosures
All market pricing and performance data from Bloomberg, unless otherwise cited. Asset class and sector performance are gross of fees unless otherwise indicated.
Asset Class Definitions
Asset class performance was measured using the following benchmarks: U.S. Large Cap Stocks: S&P 500 TR Index; U.S. Small & Micro Cap: Russell 2000 TR Index; Intl Dev Large Cap Stocks: MSCI EAFE GR Index; Emerging & Frontier Market Stocks: MSCI Emerging Markets GR Index; U.S. Interm-Term Muni Bonds: Bloomberg 1-10 (1-12 Yr) Muni Bond TR Index; U.S. Interm-Term Bonds: Bloomberg U.S. Aggregate Bond TR Index; U.S. High Yield Bonds: Bloomberg U.S. Corporate High Yield TR Index; U.S. Bank Loans: S&P/LSTA U.S. Leveraged Loan Index; Intl Developed Bonds: Bloomberg Global Aggregate ex-U.S. Index; Emerging & Frontier Market Bonds: JPMorgan EMBI Global Diversified TR Index; U.S. REITs: MSCI U.S. REIT GR Index, Ex U.S. Real Estate Securities: S&P Global Ex-U.S. Property TR Index; Commodity Futures: Bloomberg Commodity TR Index; Midstream Energy: Alerian MLP TR Index; Gold: LBMA Gold Price, U.S. 60/40: 60% S&P 500 TR Index; 40% Bloomberg U.S. Aggregate Bond TR Index; Global 60/40: 60% MSCI ACWI GR Index; 40% Bloomberg Global Aggregate Bond TR Index.
Citations
1. Polymarket: https://polymarket.com/event/when-will-the-government-shutdown-end-545?tid=1762859519215
2. Kalshi: https://kalshi.com/markets/kxgovshutlength/days-of-government-shutdown/kxgovshutlength-26jan01
3. CNBC: https://www.cnbc.com/2025/10/24/cpi-inflation-september-2025.html
4. Bureau of Labor Statistics: https://www.bls.gov/news.release/cpi.nr0.htm
5. Reuters: https://www.reuters.com/sustainability/sustainable-finance-reporting/us-weekly-jobless-claims-fall-economists-estimate-2025-10-30/
6. Federal Reserve Bank of St. Louis: https://fred.stlouisfed.org/series/ICSA
7. Federal Reserve: https://www.federalreserve.gov/mediacenter/files/FOMCpresconf20251029.pdf
8. CME FedWatch: https://www.cmegroup.com/markets/interest-rates/cme-fedwatch-tool.html
9. Department of the Treasury: https://www.fiscal.treasury.gov/files/reports-statements/mts/mts0925.pdf
10. Bloomberg data series (tariff revenues)
11. Wall Street Journal: https://www.wsj.com/livecoverage/supreme-court-tariffs-case-stock-market-11-05-2025/card/how-the-individual-justices-stand-on-tariffs-and-how-they-acted-in-the-hearing-tMIn9L1MoBU7YZm3avJF
12. FactSet: https://advantage.factset.com/hubfs/Website/Resources%20Section/Research%20Desk/Earnings%20Insight/EarningsInsight_103125.pdf
13. Meta: https://s21.q4cdn.com/399680738/files/doc_financials/2025/q3/Meta-09-30-2025-Exhibit-99-1-Final.pdf
14. Alphabet: https://abc.xyz/investor/events/event-details/2025/2025-Q3-Earnings-Call-2025-4OI4Bac_Q9/default.aspx
15. Morningstar: https://www.morningstar.com/stocks/xnas/amzn/earnings-transcripts
16. Morningstar: https://www.morningstar.com/stocks/xlim/msft/earnings-transcripts
17. Visa: https://s1.q4cdn.com/050606653/files/doc_financials/2025/q4/CORRECTED-TRANSCRIPT_-Visa-Inc-V-US-Q4-2025-Earnings-Call-28-October-2025-5_00-PM-ET.pdf
18. Morningstar: https://www.morningstar.com/stocks/xber/m4i/earnings-transcripts
19. Bank of America: https://institute.bankofamerica.com/content/dam/economic-insights/consumer-checkpoint-october-2025.pdf
20. MacroMicro: https://en.macromicro.me/charts/23462/us-redbook-same-store-index
21. Reuters: https://www.reuters.com/world/asia-pacific/trump-takaichi-agree-rare-earth-critical-minerals-supply-2025-10-28/
22. CNN: https://edition.cnn.com/2025/10/27/business/us-china-trade-talk-malaysia-intl-hnk
23. Reuters: https://www.reuters.com/business/us-treasurys-bessent-says-feds-language-shows-they-are-stuck-past-2025-10-30/